Delivery steering: capacity, staffing and weekly cockpit on one data set
One week, one data set: KPIs with a definition, capacity including absences, staffing with its decision status and a weekly cockpit you can put in front of management.
The starting point
The trouble with Excel
One KPI, three formulas
Every team calculates utilisation differently. In the KPI catalog each KPI has exactly one definition with formula, base and owner; conflicting versions go to the conflict register.
Staffing without a decision status
Who is planned, who is committed? The staffing board separates draft, decided and booked; overbookings are confirmed one by one.
Weekly reports by copy and paste
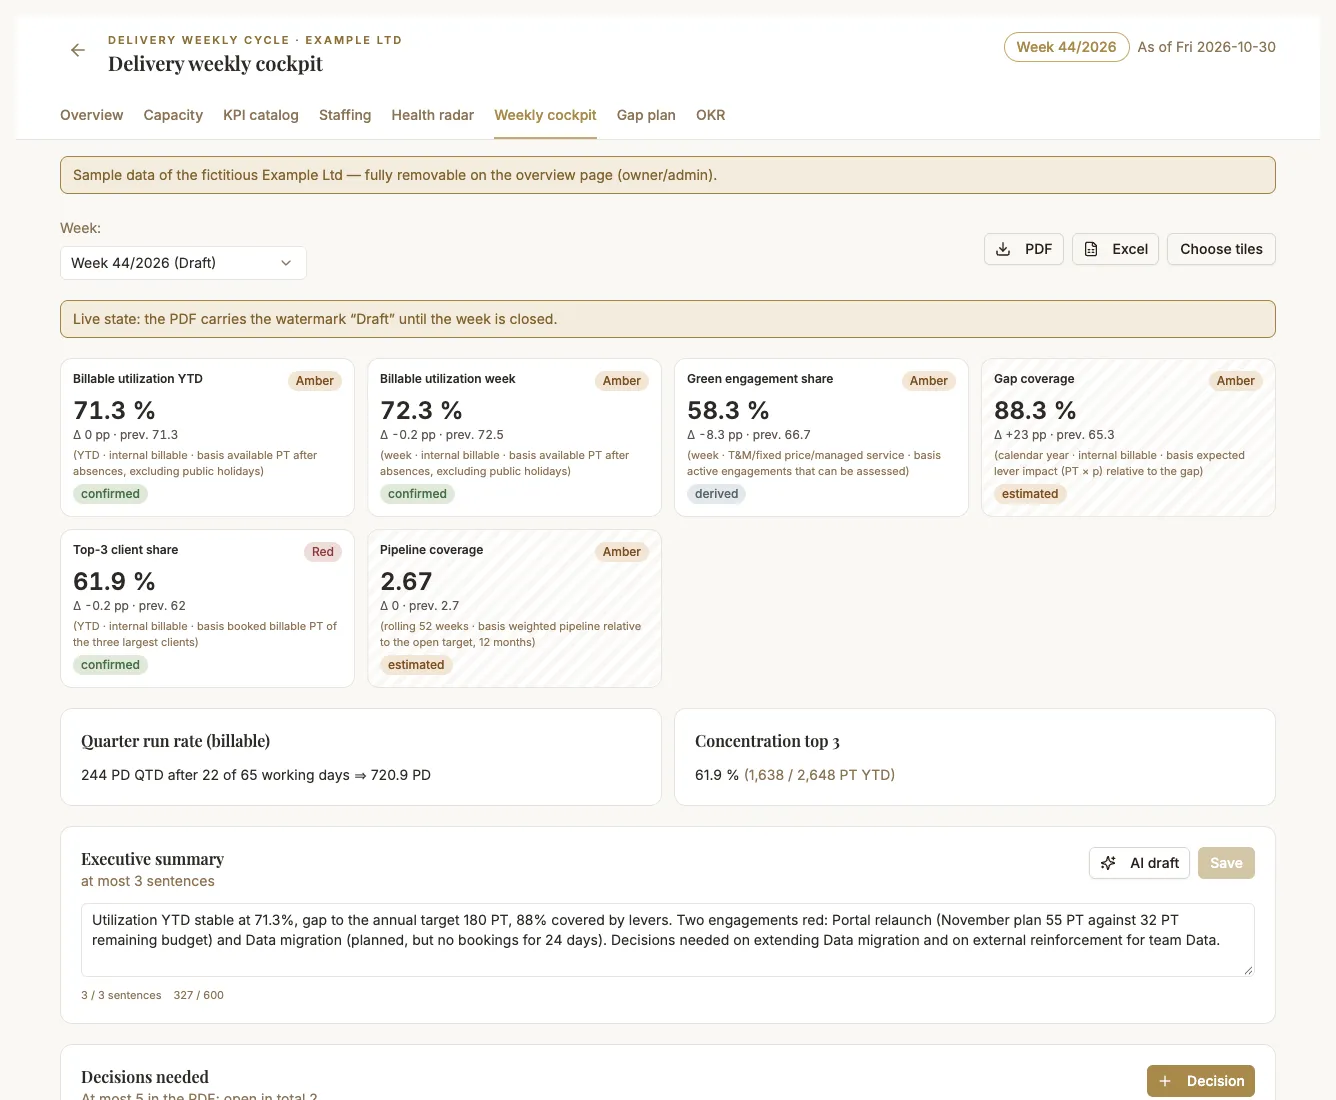
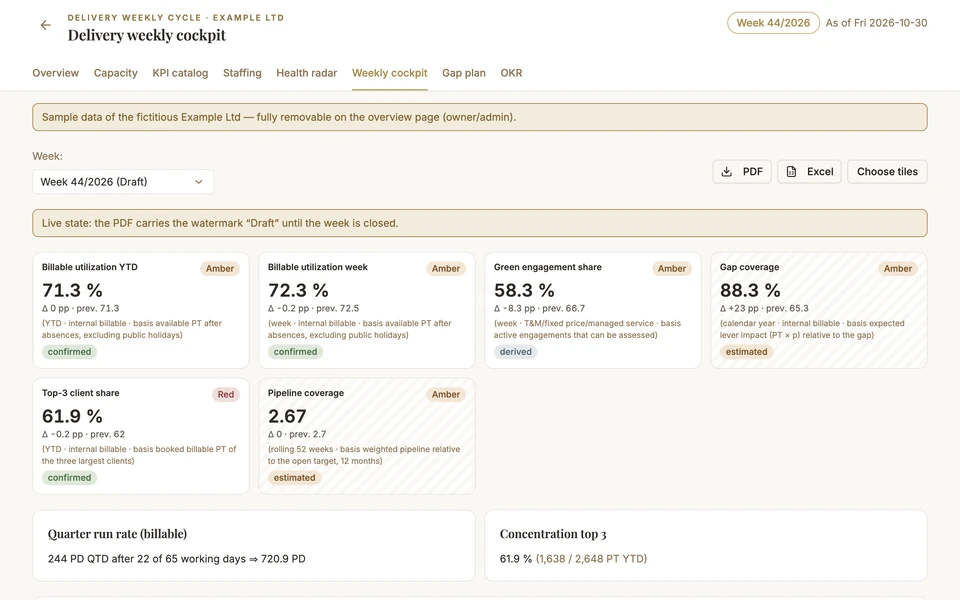
The weekly cockpit comes from the same data: KPIs, change against last week, executive summary and decisions needed, exportable as a PDF.
Building blocks
7 templates, one data set
Every view reads the same data. There is exactly one cycle per workspace.
Delivery weekly cycle
Overview and setup: calendar with public holidays for DE/AT/CH, teams, people, engagements, roles and the quarterly OKR module.
OpenKPI definition catalog
One definition per KPI with formula, base, owner and version history; conflicts become visible.
OpenCapacity forecast with sales view
Attendance, absences and unrecorded load; plus a sales view with free capacity per role.
OpenStaffing board with decision layers
Assignments in the states draft, decided and booked; overbookings are flagged and confirmed individually.
OpenProject health radar
Rule-based early warning per project with 11 standard rules; every signal with source and confidence.
OpenUtilization gap plan
Utilisation gap in person-days, levers with impact and probability, a weekly path.
OpenDelivery weekly cockpit
KPIs of the week, change against last week, executive summary and decisions needed; export as a PDF.
OpenDelivery steering
One week, one data set
KPI catalog, capacity, staffing, health radar and weekly cockpit work from the same numbers. Closed weeks stay frozen; corrections run as revisions with a reason.
- KPIs with formula, basis and owner – conflicts become visible
- Staffing in three states: draft, decided, booked
- Health radar with 11 rules, each signal with source and data freshness
- Weekly cockpit as a PDF of at most two pages
Roles are built in: sales sees free capacity per role – without names or costs.
KPI definition catalog
One definition per KPI: formula, base, owner, decision history.
Capacity forecast with sales view
Attendance, absences and unrecorded load – with a sales view.
Staffing board with decision layers
Assignments with states draft, decided, booked.
Project health radar
Rule-based early warning – every signal with source and confidence.
Delivery weekly cockpit
Weekly values, delta to last week, decisions needed – as a 2-page PDF.
Utilization gap plan
Gap in person-days, levers with impact × probability, weekly path.
Weekly routine
Three steps each week
01
Update the data
Maintain capacity, bookings and project signals for the current calendar week – directly or via CSV/Excel import.
02
Review the cockpit
Check status lights, deltas and confidence per value; add the executive summary and the decisions needed.
03
Close the week
Closing freezes the state. Frozen weeks are immutable; corrections run as revisions with a mandatory reason.
Roles
Who sees which numbers?
Visibility is enforced on the server: whatever a role must not see never leaves the server.
| View | Sees |
|---|---|
| Owner, admin, editor | All cycle data; editing depends on the team role. |
| Without costs | Everything except cost rates and monetary values. |
| Leadership | Like “without costs”; quarterly OKRs only once approved, rows per person only if enabled. Read-only. |
| Sales | Free capacity per role and the binding KPI definitions – without names or costs. |
Sample export
The weekly cockpit as a PDF (2 pages)
This is what the export for management looks like – generated from the product's sample data.
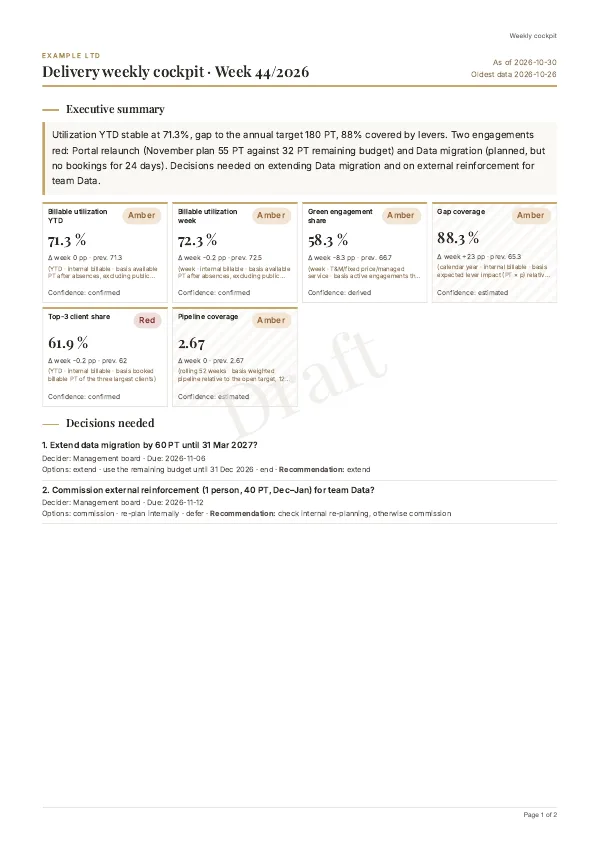
Page 1: executive summary, KPIs with change against last week and decisions needed. Page 2: status lights, risks, teams and initiatives.
Download PDFSample data of a fictitious company, exported with the product.
FAQ
Frequently asked questions on delivery steering
Do I need time tracking or a Jira integration?
No. You enter capacity, bookings and project signals directly or import them as a CSV or Excel file. There is no integration with time tracking, Jira or ERP, and none is needed.
What does “frozen week” mean?
Closing the week saves the state as a snapshot that cannot be changed afterwards. Corrections run as revisions with a mandatory reason, so changes against last week stay traceable.
Who sees which numbers?
Owners, admins and editors see all data; individual members can be given a view without costs, a leadership view or the sales view. Sales sees only free capacity per role and the KPI definitions, without names or costs. The separation happens on the server.
Does it work without the other templates?
Yes. The 7 cycle templates share one data set and need no other templates. Assessments, registers and the regulatory cockpit can be used independently.
How much does the weekly delivery cycle cost?
It is part of the Professional plan: €29 per month or €249.90 per year; your first subscription includes 14 days free. Cancel in your account, effective at the end of the billing period.
Further reading
Further reading and related templates
- What is IT Delivery Management? A Complete Guide
- What a Coding Agent Really Costs: Tokens, Energy and Rework as Delivery KPIs
- DORA Metrics Explained: The 5 Key Metrics for Software Delivery
- Cost of Delivery: Why FinOps Is Now Your Concern Too
- Evidence-based skill matrix
- Resource & Capacity Planning · in the Free plan
Next week on one data set
Load sample data, review the cockpit, close the week – the weekly cycle is part of Professional.