Delivery weekly cycle
One shared data set for the delivery week: capacity, staffing with three layers, KPI catalog, health radar, gap plan, OKR and weekly cockpit — with frozen weeks instead of copy and paste.
Product view
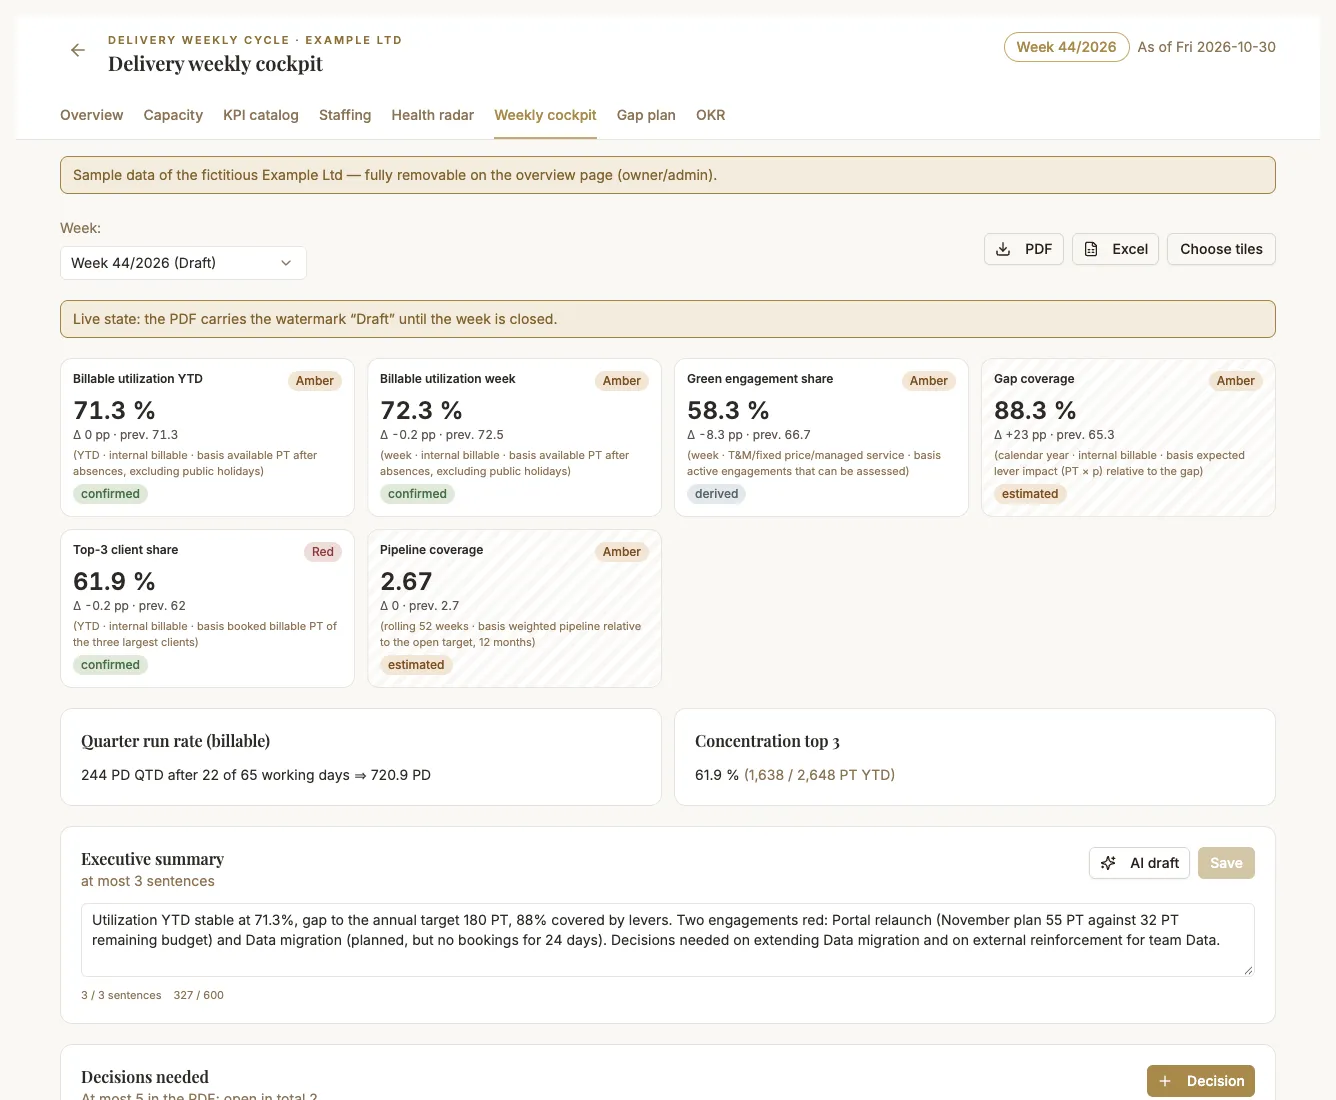
The weekly cockpit with sample data
Building blocks
One data set for the whole week
The cycle combines 6 views of the same data; each has its own detail page.
- Capacity forecast with sales view
- Delivery weekly cockpit
- KPI definition catalog
- Project health radar
- Staffing board with decision layers
- Utilization gap plan
Sample export
The weekly cockpit for management
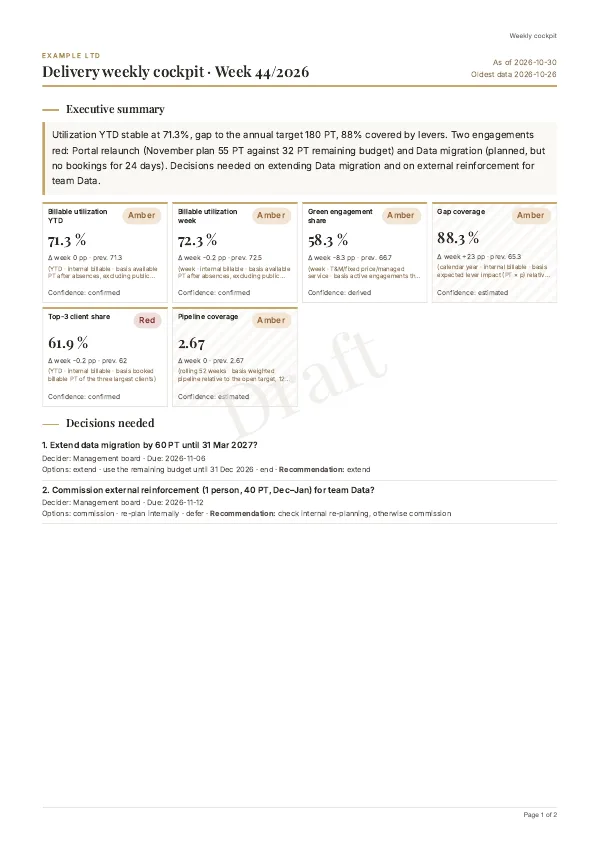
Weekly cockpit as a PDF (2 pages)
Executive summary, KPIs with change against last week, decisions needed, status lights, risks and initiatives – generated from the sample data.
Sample data of a fictitious company, exported with the product.
3 · Building blocks
What the weekly cycle covers
One shared data set for the delivery week: every view works with the same figures.
Setup
Calendar, teams, people, engagements, KPIs
5 functionsWeekly routine
Data → KPIs → staffing → health → gap → cockpit → decision → close
8 functionsOKR
Quarter goals with key results from KPIs
1 functionPut the delivery week on one data set
Load a sample workspace, add your own teams and engagements, freeze weeks and compare them.
FAQ
Frequently asked questions
No. You enter capacity, bookings and project signals directly or import them as a CSV or Excel file.
Closing the week saves the state so that it cannot be changed. Corrections run as revisions with a mandatory reason.
Visibility is enforced on the server: sales sees only free capacity per role without names or costs, leadership reads without cost rates.
It is part of the Professional plan: €29 per month or €249.90 per year; your first subscription includes 14 days free.