Start Industry Comparison
An assessment score alone says little — it only becomes meaningful when compared with real industry data. The benchmark feature in Alev-B compares your results with data from published industry reports (DORA, NIST, Gartner, Verizon DBIR, and others) and shows you where your client stands relative to the market.
Prerequisites
- Assessment at least 50% completed
- For precise results: client profile with industry and company size maintained (optional but recommended)
Starting the Industry Comparison
Click the benchmark button in the workspace
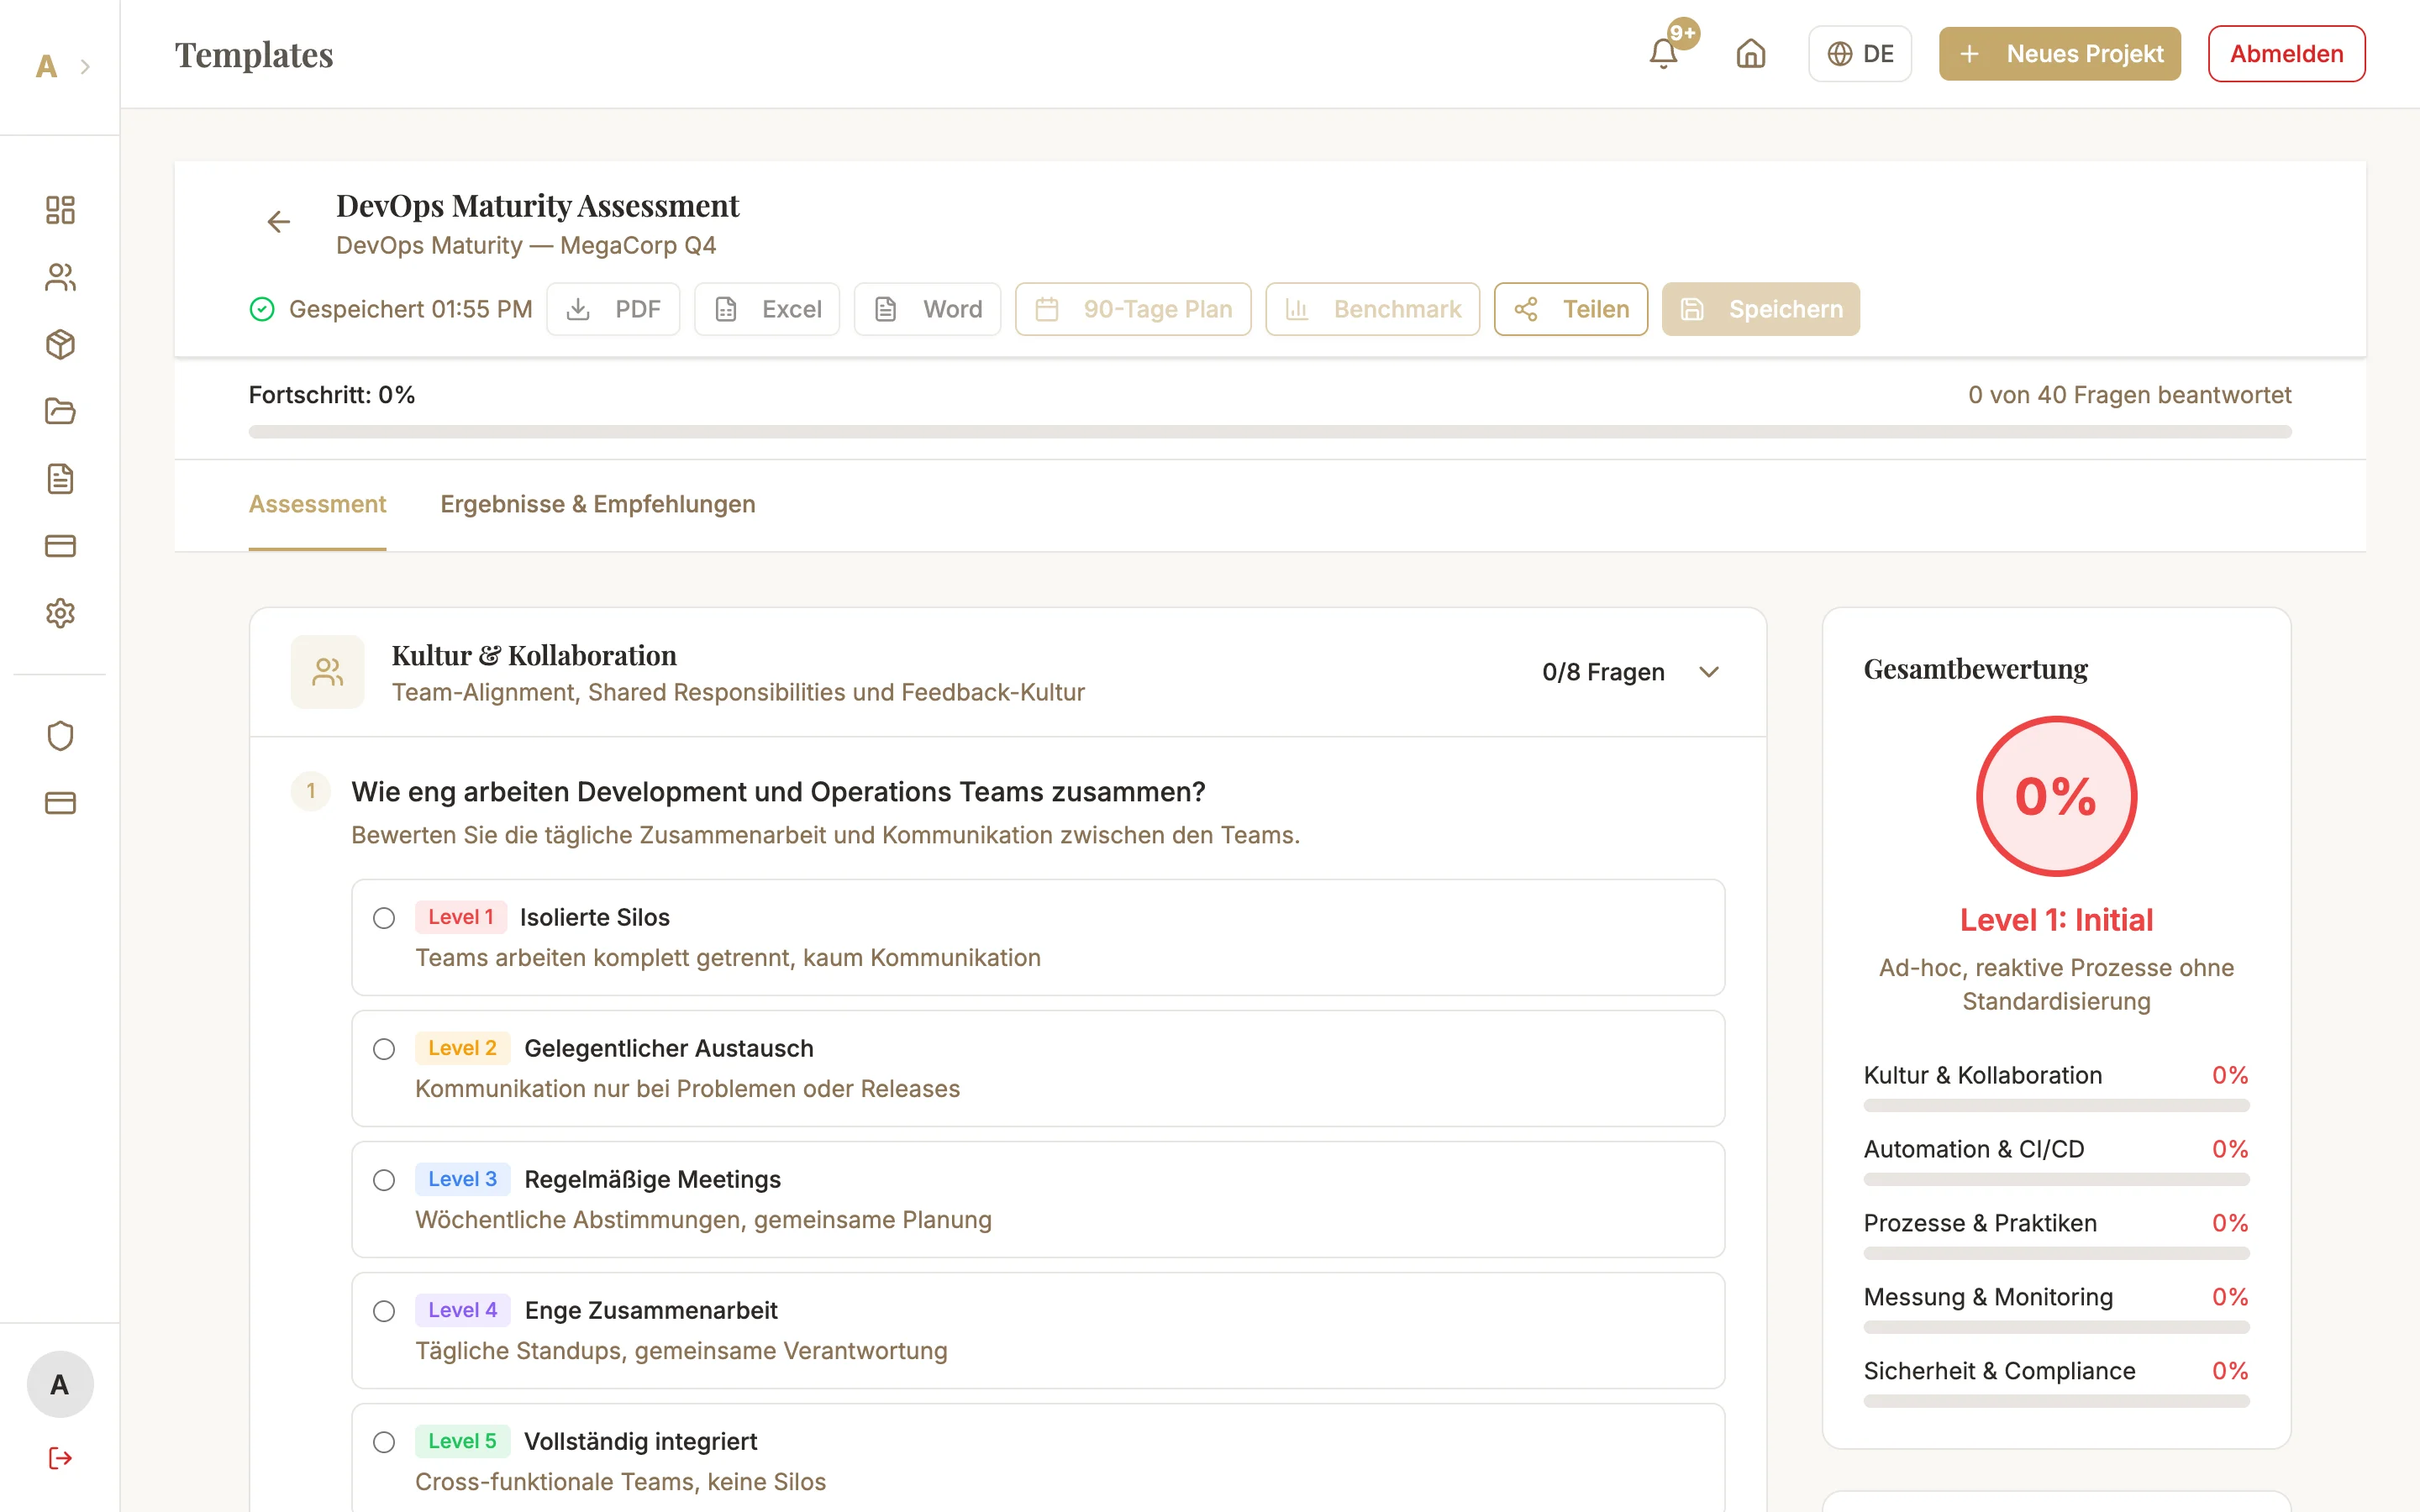
Open the assessment in the workspace. In the top toolbar you see the "Benchmark" button (bar chart icon). It is active once the assessment is at least 50% complete. Click it.
Read the results modal
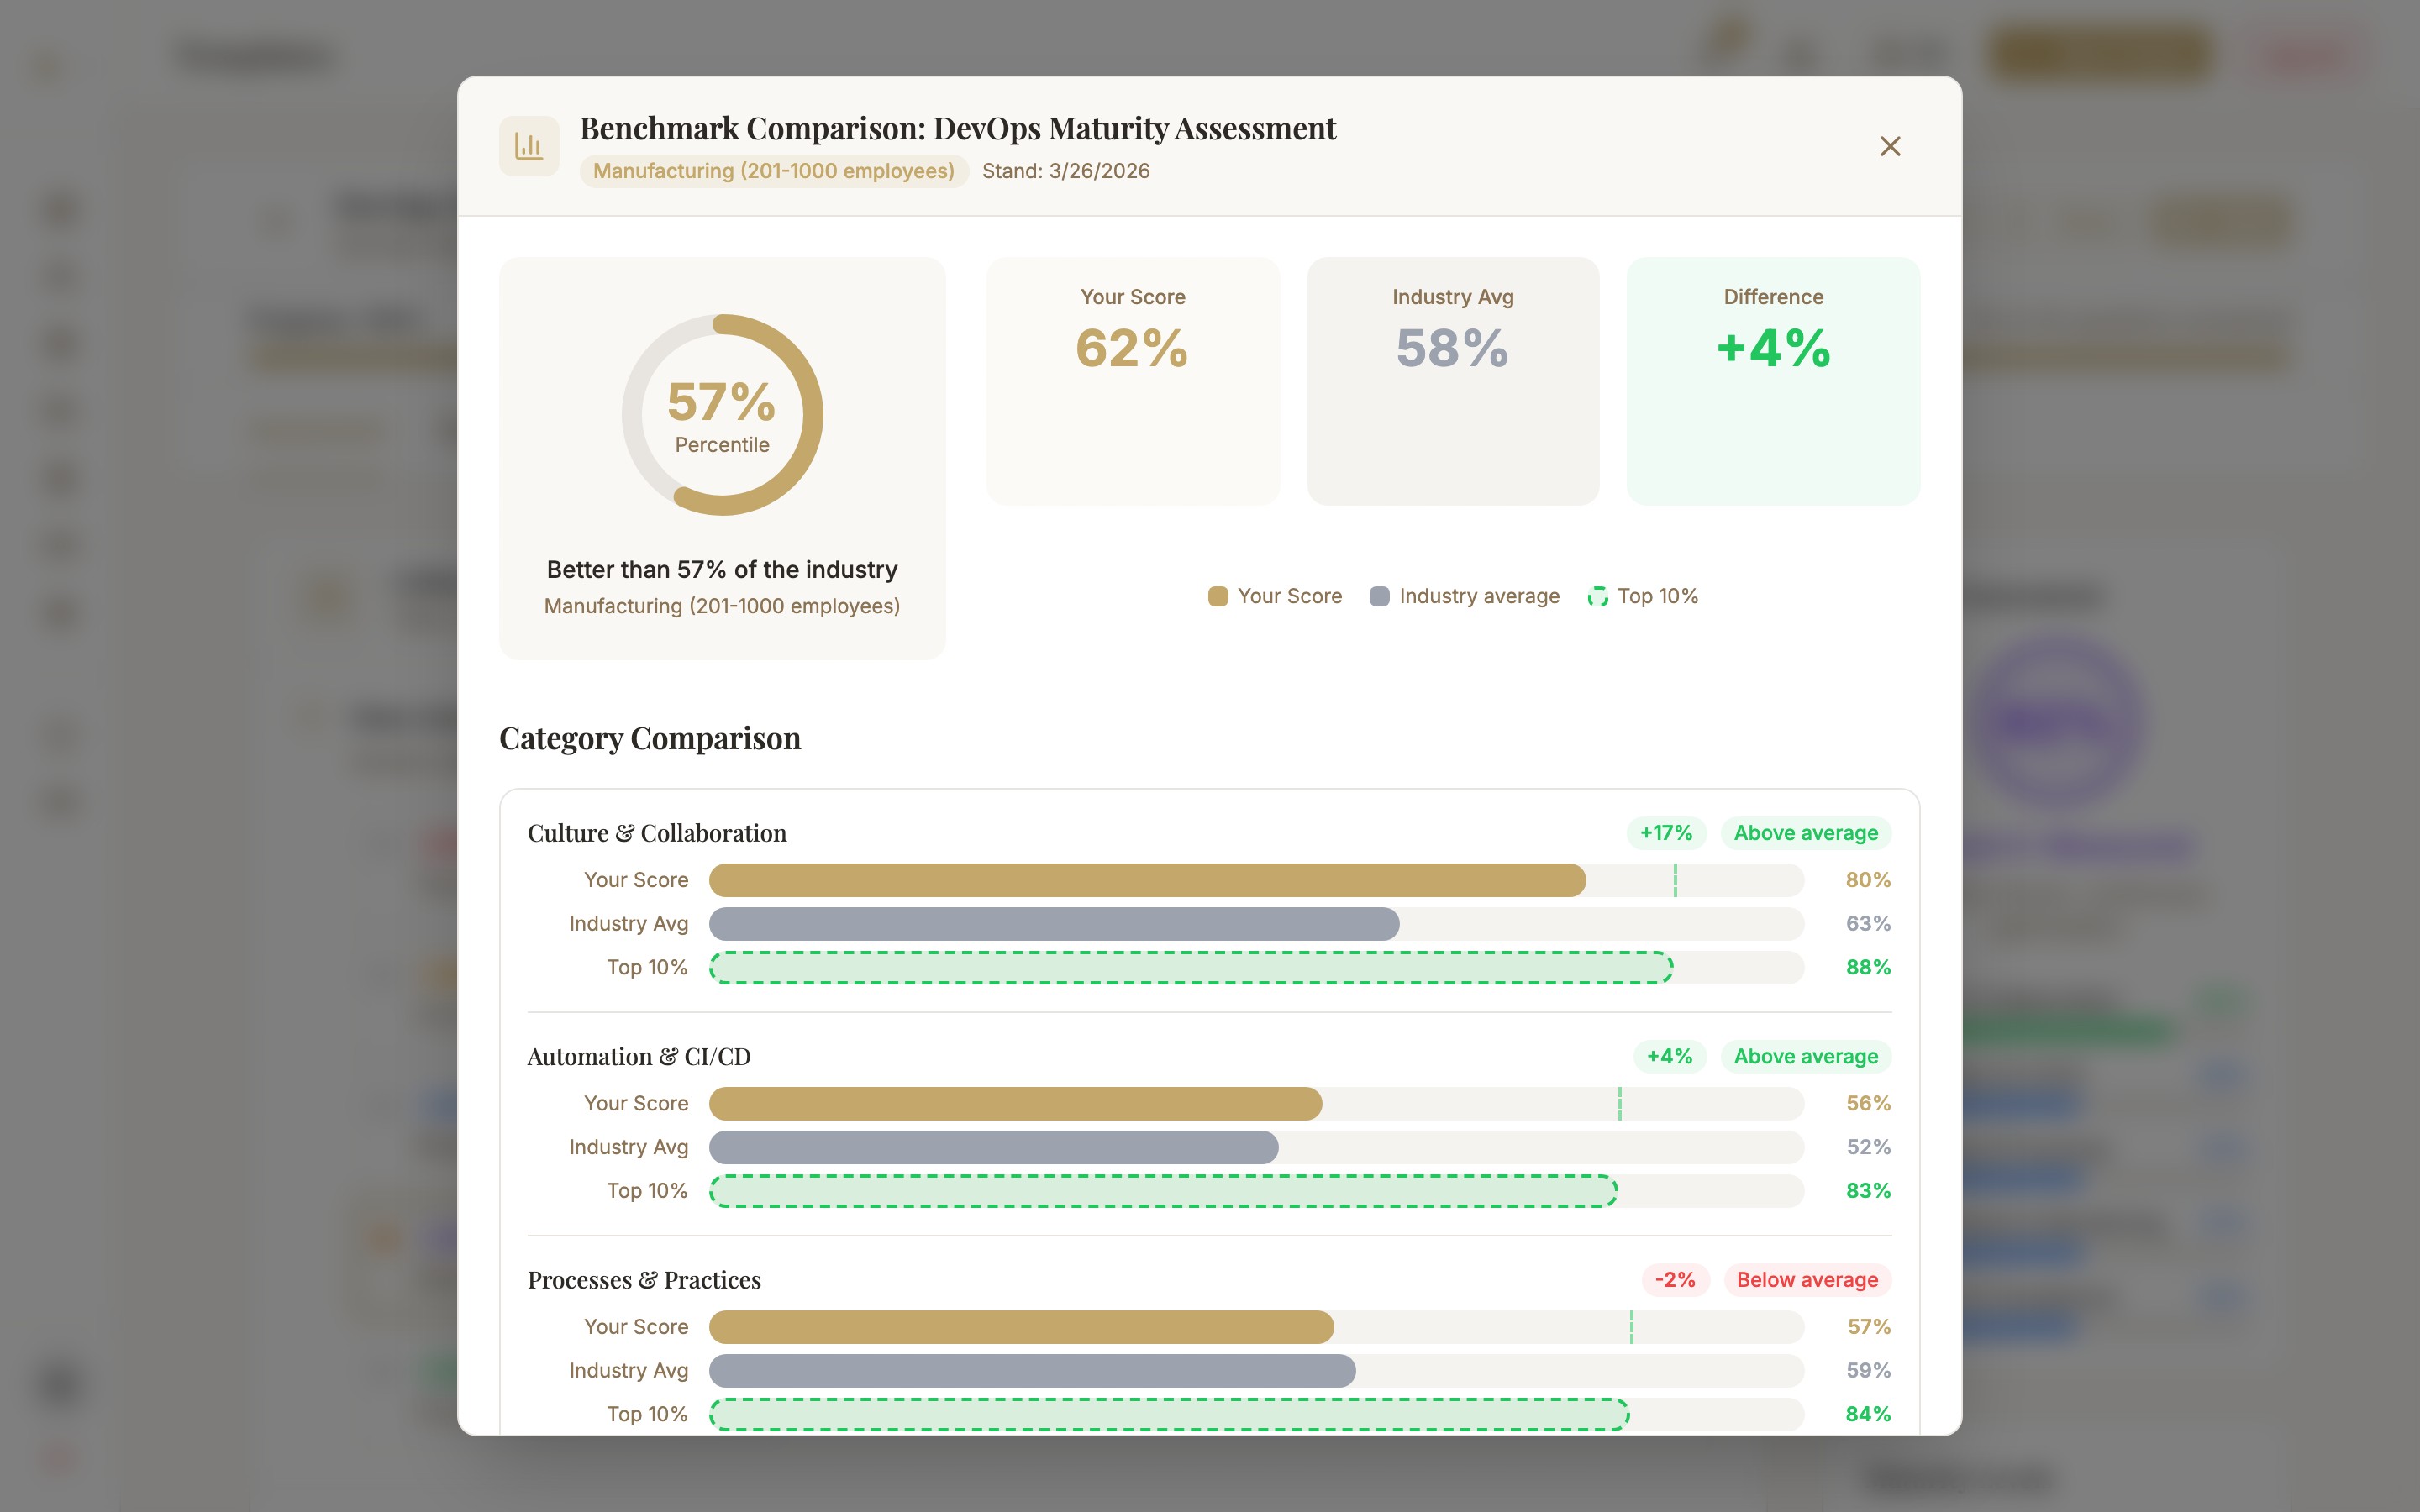
The benchmark modal opens and shows you:
- Percentile rank — Where your score stands compared to other companies in the same industry and size bracket (e.g. "Top 25%")
- Category comparisons — Each template category is compared separately — so you see at a glance in which areas the client is strong and where there is room for improvement
- Insights — AI-generated prose that puts the benchmark data into narrative context: what does this score mean for a company of this size and industry?
Review the sources
At the bottom of the modal you see which data sources were used for this comparison — e.g. "DORA State of DevOps 2024" or "Verizon DBIR 2024: Financial Services". This increases credibility in client conversations: you can reference the sources directly.
How It Works
When you click the benchmark button, the following happens in the background:
- The server loads the appropriate benchmark datasets from the database — depending on the template type, the client's industry, and company size.
- The real benchmark values are injected into an AI prompt, together with your assessment scores and free-text answers.
- The AI (Gemini) generates a contextualized comparison — not generic filler text, but a substantive analysis based on the concrete numbers.
Common Issues
Benchmark button is greyed out
The button only becomes active when the assessment is at least 50% complete. Check the progress bar at the top. Answer more questions — especially scale questions that affect the numeric score.
"Update client profile" message appears
The benchmark comparison is less precise if the client's industry and company size are not maintained. Go to Clients → Edit Client and add industry and size. Clicking the benchmark again afterwards will generate significantly more specific results.
Benchmark shows "No data available" for a category
For some very specific categories or template types, no industry comparison data is yet available. In this case the AI uses global averages and explicitly indicates this. More data sources are continuously being added — current coverage viewable under "Real Data Sources".
Next Steps
- Real Data Sources — which reports and studies power the benchmarks
- Compare Another Industry — flexibly explore different scenarios
- Benchmark in PDF Report — embed comparison data in client presentations