Real Data Sources
Transparency matters to us. Behind every benchmark comparison in Alev-B are real, publicly available studies and reports — no internally estimated numbers. This page documents which data sources we use, what they measure, and how they feed into the benchmark calculations.
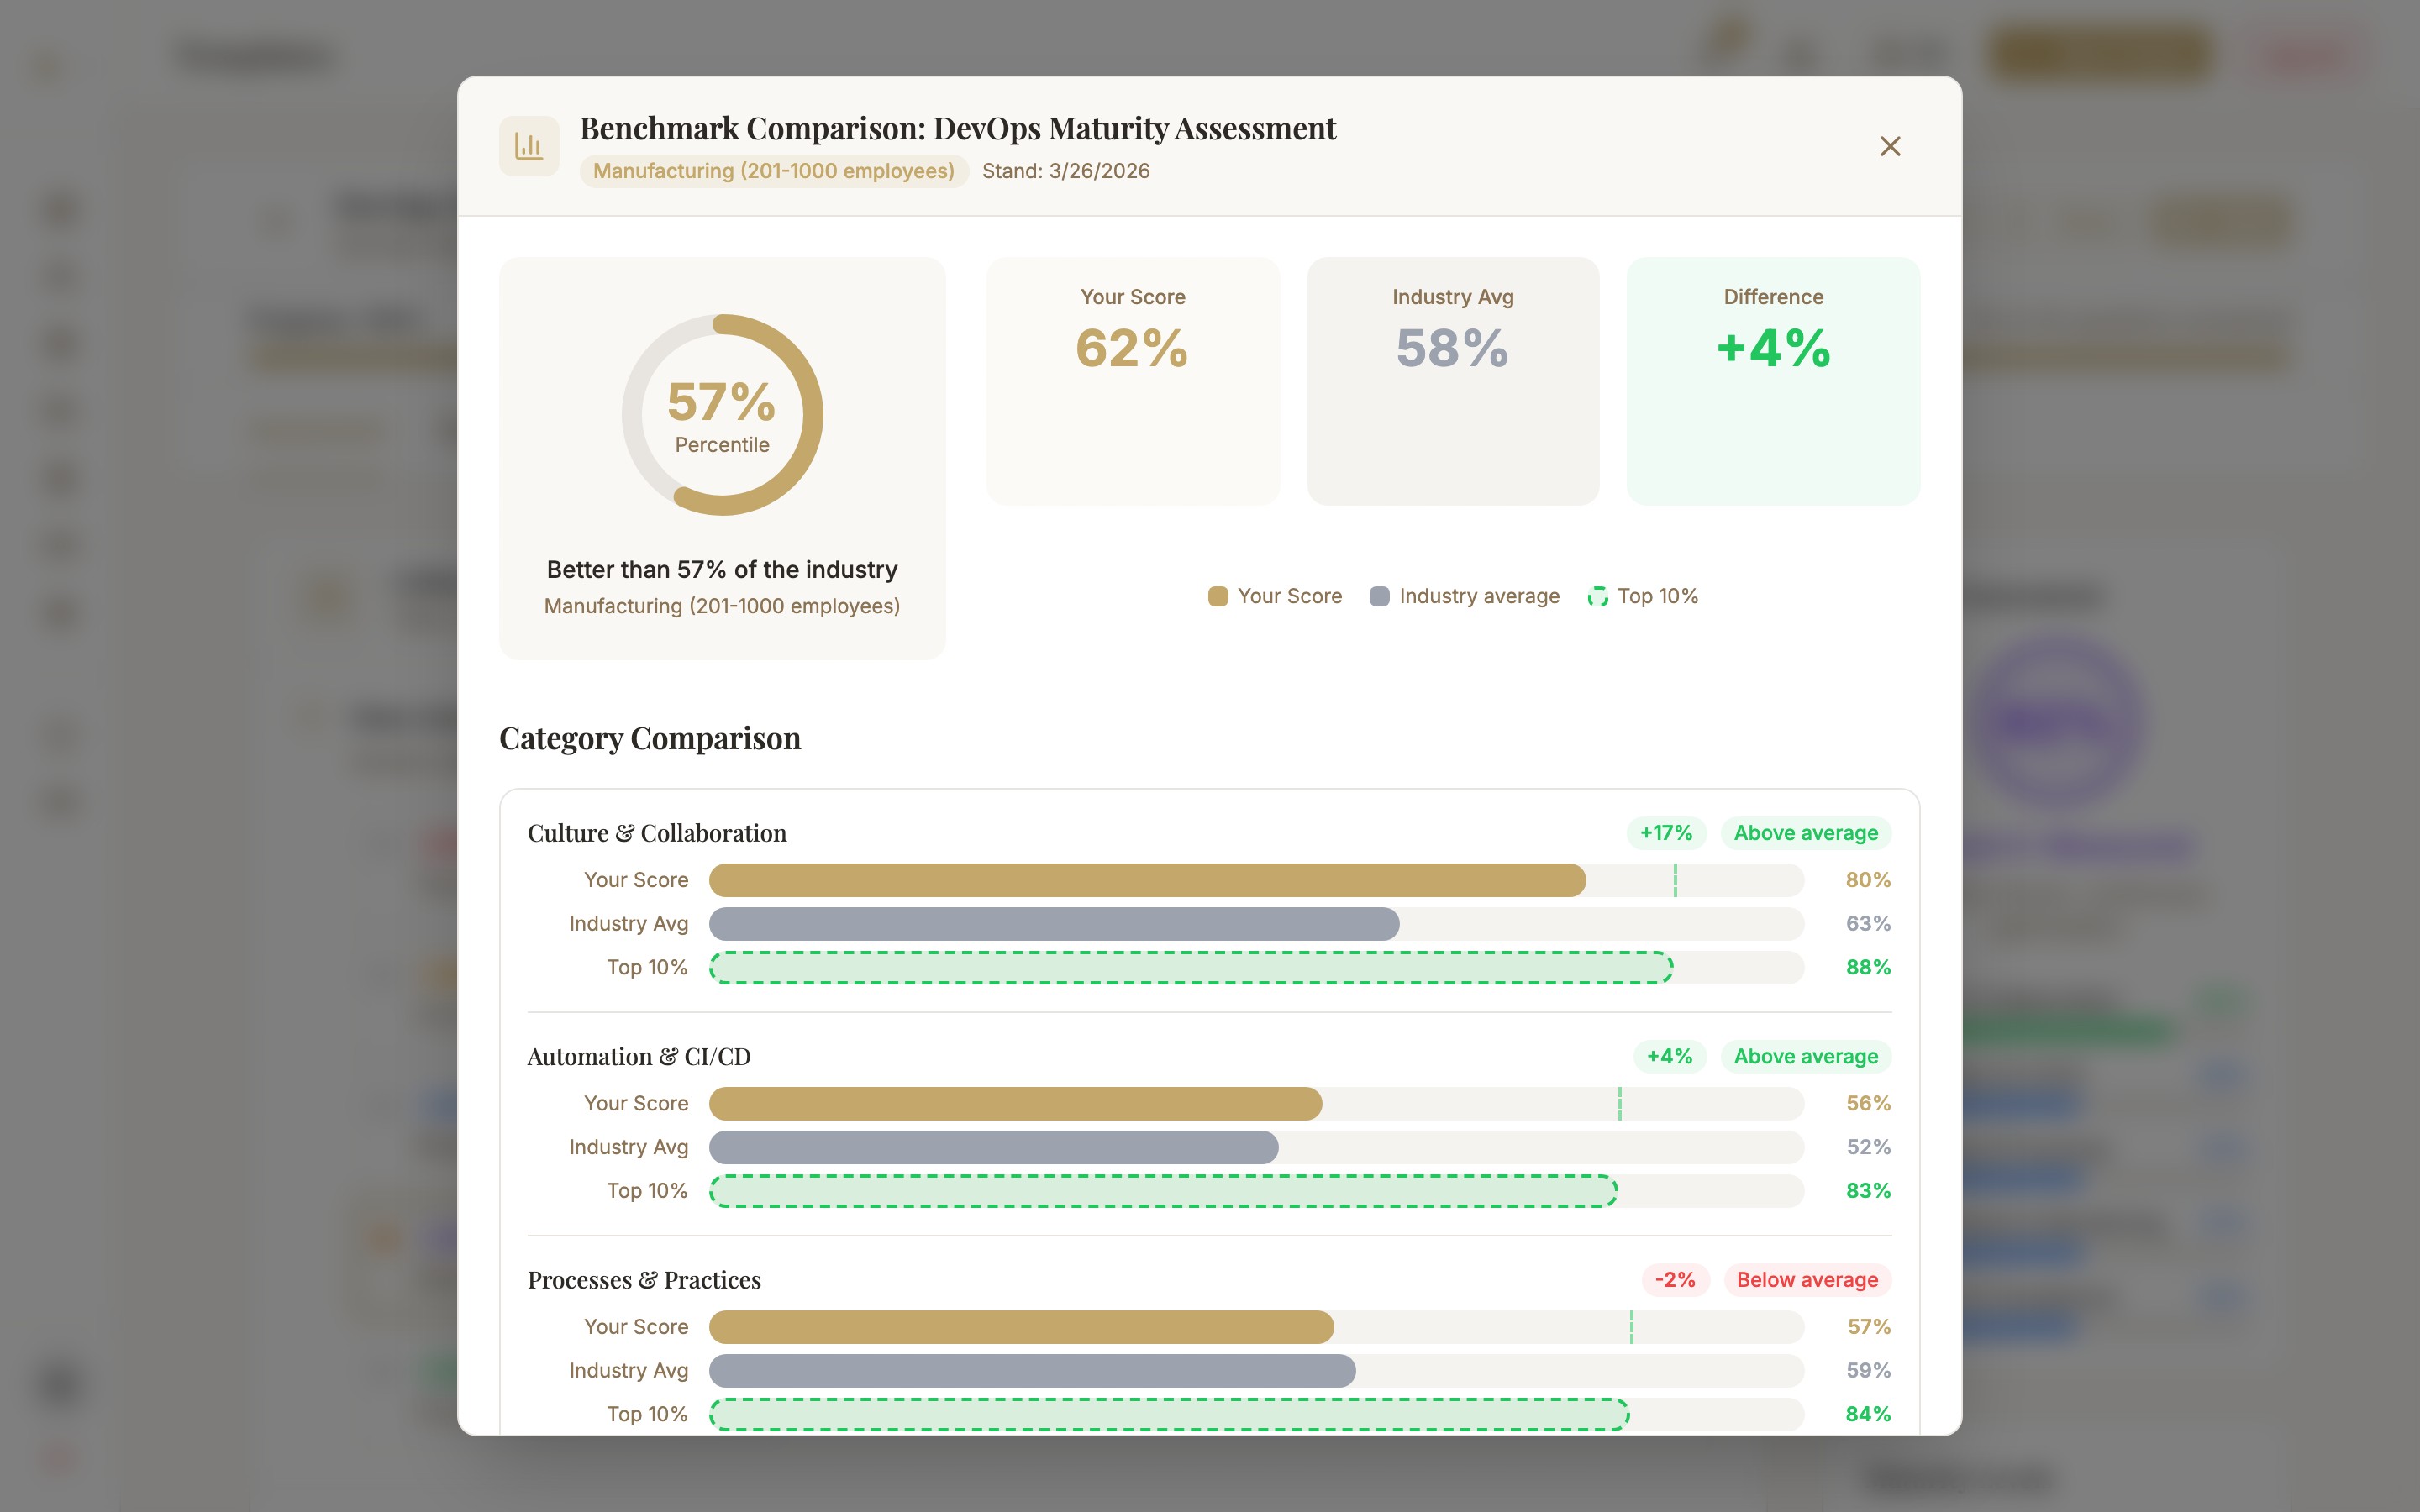
DORA State of DevOps 2024
The DORA report (Google / DORA Research Program) is the gold standard for DevOps maturity measurement. The study surveys thousands of software organizations worldwide annually.
Measured metrics (DORA Four Keys):
- Deployment Frequency — How often is deployed to production? Elite: multiple times per day | High: once per day to weekly | Medium: once per week to monthly | Low: less than monthly
- Lead Time for Changes — Time from commit to production. Elite: < 1 hour | High: 1 day to 1 week | Medium: 1 week to 1 month | Low: > 6 months
- Change Failure Rate — Percentage of deployments causing an incident. Elite: 0–5% | High: 5–10% | Medium/Low: 11–30%
- MTTR (Mean Time to Restore) — Recovery time after a failure. Elite: < 1 hour | High: < 1 day | Medium: 1 day to 1 week | Low: > 6 months
NIST Cybersecurity Framework 2.0
The NIST CSF 2.0 (National Institute of Standards and Technology) is the international reference framework for cybersecurity maturity assessments, updated in 2024 with a new "Govern" function.
- 4 Tiers: Partial (1) → Risk Informed (2) → Repeatable (3) → Adaptive (4)
- 6 Functions: Govern, Identify, Protect, Detect, Respond, Recover
Gartner AI Maturity Model
The Gartner AI Maturity Model assesses the AI maturity of organizations on 5 levels — from opportunistic experiments to transformative, AI-native business models.
- Level 1 — Awareness (individual projects without strategy)
- Level 2 — Active (pilot projects, initial governance)
- Level 3 — Operational (scaling, MLOps)
- Level 4 — Systemic (AI as core competency)
- Level 5 — Transformational (AI-native business model)
CIS Controls v8
CIS Controls (Center for Internet Security) are 18 prioritized security measures, divided into three Implementation Groups (IG) by company size and risk profile.
- IG1 — Basic protection for small companies (6 controls)
- IG2 — Extended measures for medium-sized companies (16 controls)
- IG3 — Full implementation for complex environments (all 18 controls)
FinOps Foundation
The FinOps Framework describes cloud cost management in three maturity stages, reflecting the typical adoption path of organizations.
- Crawl — Basic visibility, manual processes
- Walk — Automation, account structure, budget alerts
- Run — Full governance, real-time optimization, FinOps culture
Verizon DBIR 2024
The Verizon Data Breach Investigations Report (DBIR) annually analyzes thousands of security incidents worldwide, broken down by industry. The industry-specific data from DBIR 2024 flows into our security benchmarks:
- Financial Services — Credential attacks, insider threats
- Healthcare — Ransomware, misconfigurations, insider errors
- Manufacturing — OT/ICS attacks, espionage
- Retail — POS attacks, e-commerce skimming
- Public Sector — Espionage, DDoS, misconfigurations
- Education — Ransomware, social engineering
Next Steps
- Compare Another Industry & PDF Benchmark — comparison scenarios and PDF integration
- Start Industry Comparison — run your first benchmark analysis